

50 years ago, “continental drift” was a fringe hypothesis rejected by most geologists. Today the theory of plate tectonics (which includes continental drift) is universally accepted as true, and unifies once-separate areas of geology under one grand banner.
There are mountains of evidence (literally) that plate tectonics has taken place in our planet’s past. But how do we know that the continents are still drifting, right now? And how do we know what direction each one is moving, how fast they’re going . . . how do we know what we know about plate tectonics?
Top photo credit: Antonio Snider-Pellegrini/Wikimedia Commons.
By Listening To Quasars
First discovered in the early ’60s, quasars are very, very, very far away . . . almost always billions of light years. (We can only see them at this immense distance because they’re also incredibly bright.) This makes them useful as fixed points of reference in the sky, as they appear completely stationary.
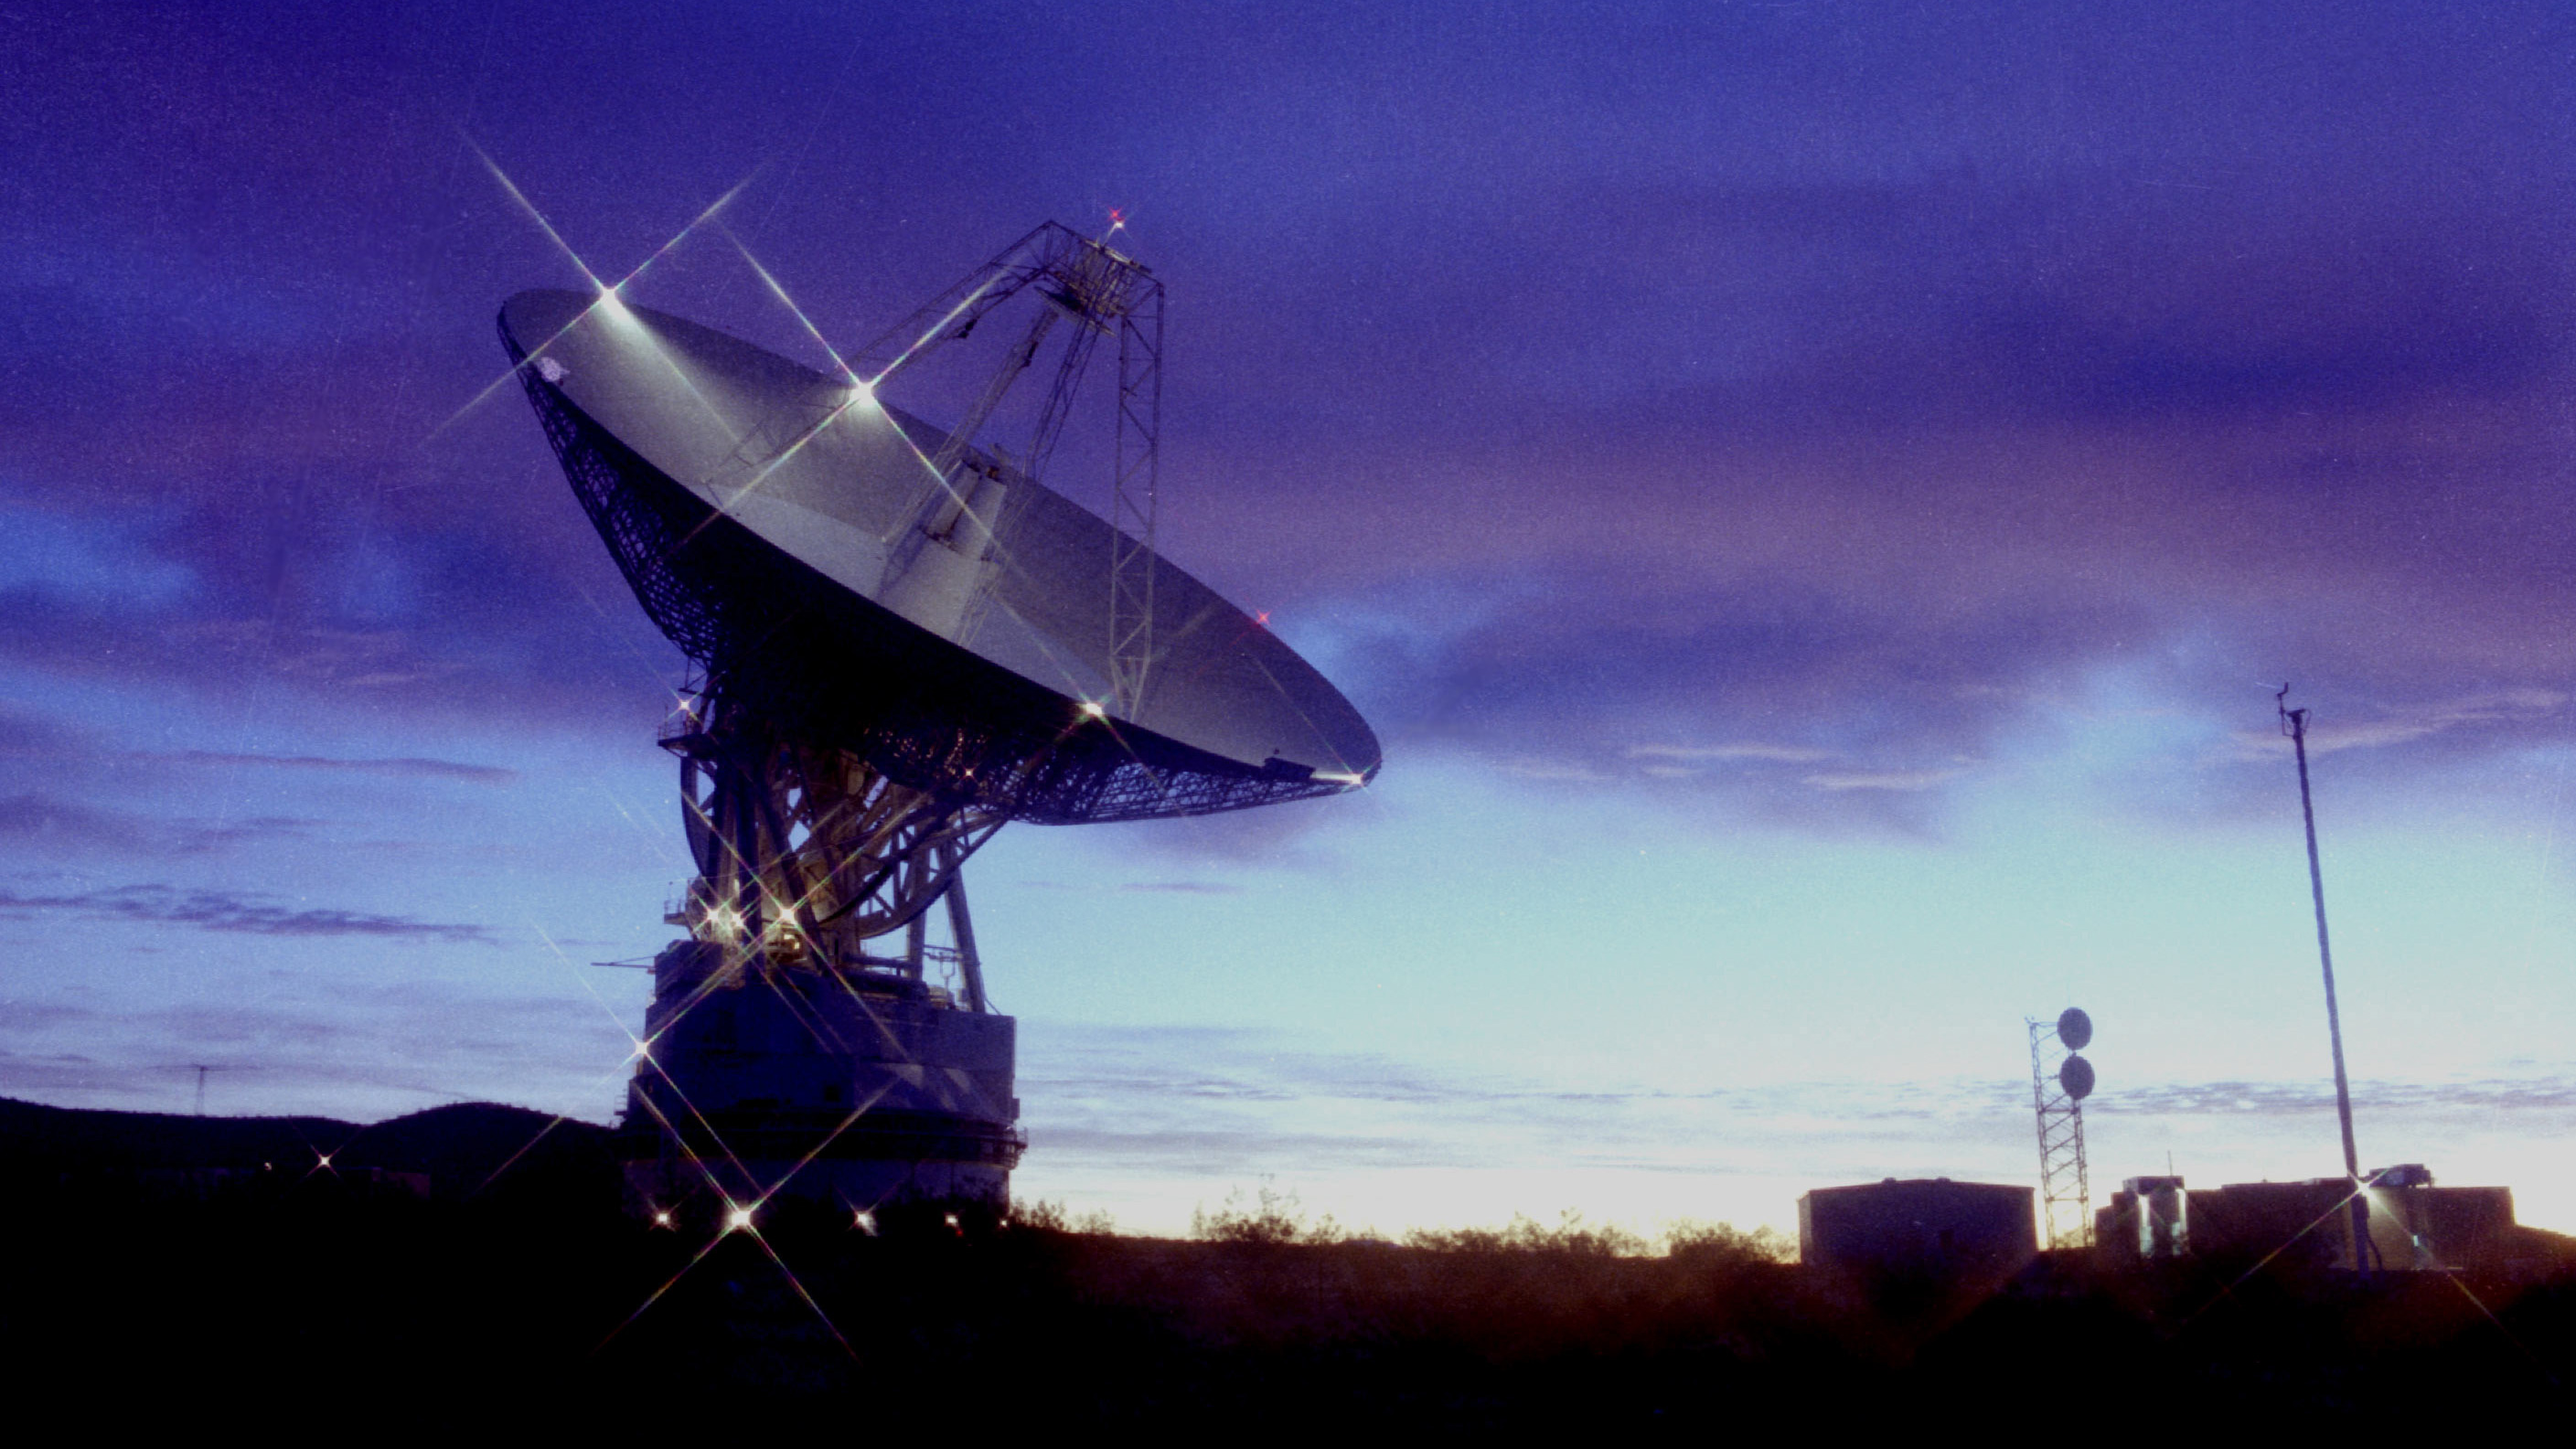
Because they make good points of reference, radio telescopes around the world tune into quasars on a regular basis. These radio telescopes are also connected to atomic clocks, recording precise atomic timestamps along with their signals. And in the early ’80s, a few very clever astrophysicists figured out how to use those timestamped quasar recordings to measure continental drift.
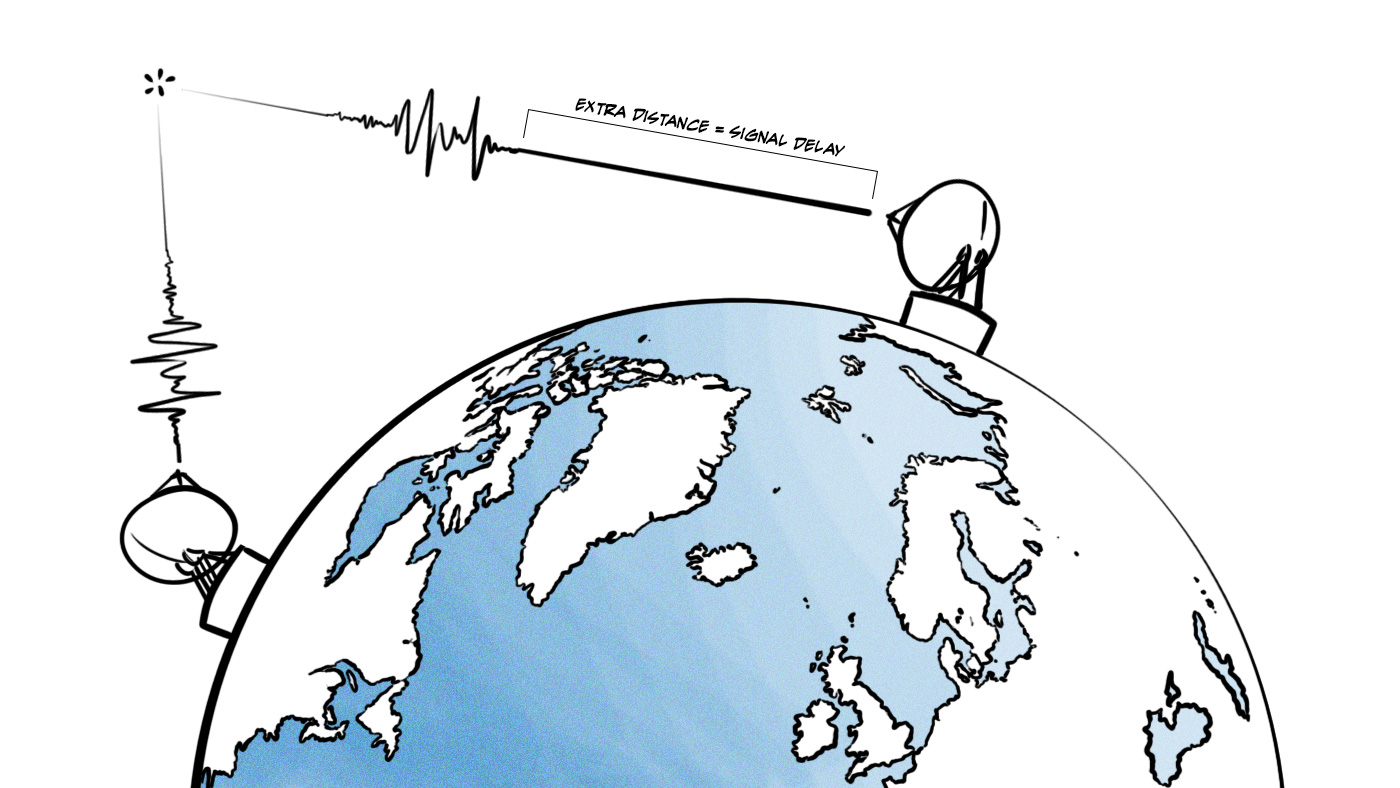
If two radio telescopes (on different continents) tune into the same quasar at the same time, both telescopes will hear the same radio signal . . . but one telescope will hear it a little later, because one will be a little further away from the source, so the radio signal takes a few extra milliseconds to reach it.
Radio signals, being light, move very quickly (~300,000 km/s). But the cesium-based atomic clocks in those early-80’s radio telescopes “ticked” at a rate of ~9.2 billion ticks per second. In the time it took for one atomic clock tick, light could only travel about 3 cm.
By measuring the delay in the quasar recordings between the two stations (and by repeating this process at many angles with other quasars in different parts of the sky), those ’80s scientists were able to triangulate (within a few centimeters) exactly how far apart any two radio telescopes were from each other.
With a precise measurement of how far apart two spots on different continents were, it was only a matter of time before they could see that the continents were indeed drifting. Over many years (and after adding many more radio telescopes to the pool) they saw some telescopes creeping towards one another, and other telescopes drifting apart. Continental drift was happening, and they could finally measure it!
Just for fun: listen to a quasar, courtesy of astrophysicist Paul Francis.
With GPS (a.k.a. Atomic Clocks In Space)
In 1989, the first non-prototype GPS satellite went into orbit. By 1995 the GPS system was in full swing, with 24 orbiting satellites each boasting 4 onboard atomic clocks. While GPS’s primary applications are more day-to-day oriented, the introduction of GPS gave NASA a new tool for observing and measuring continental drift.
Over the years, NASA’s Jet Propulsion Laboratory has placed over 2000 GPS devices around the world, each of which has recorded its position (and change in position) regularly ever since. The resulting data set, available on JPL’s GPS Time Series website, shows absolutely clear patterns of tectonic drift over time.
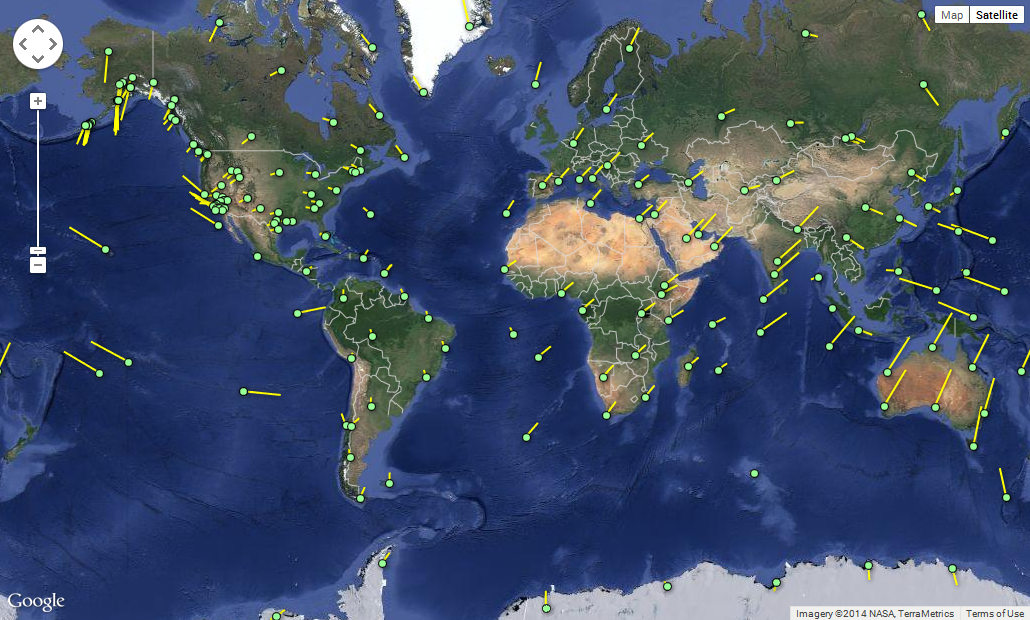
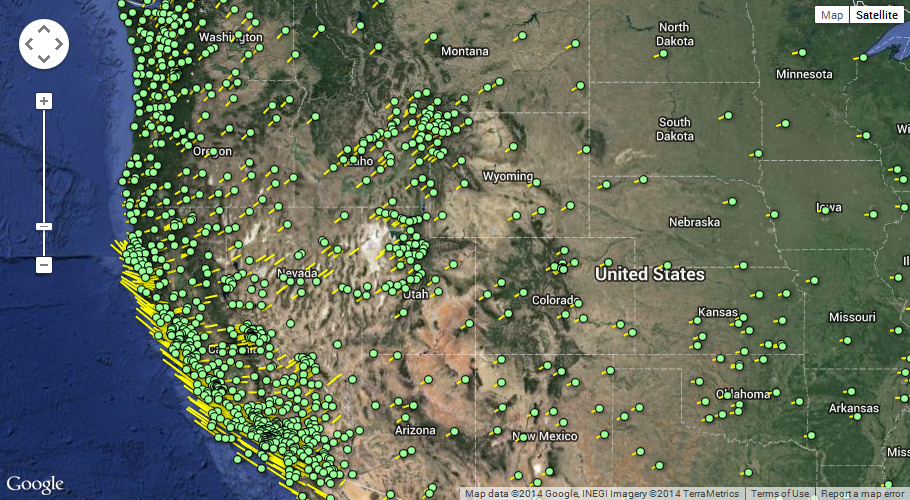
Zooming in on their interactive map reveals all 2000+ sensors. Each green dot represents a sensor’s position, and the yellow lines represent direction and speed of drift. You can see below, for example, that the west coast of California is moving in a different direction than the rest of the North American continent . . . which makes sense, since western California is on a different tectonic plate than North America, with the San Andreas fault serving as the boundary between the two.
You can also click on any data point to see it’s displacment (latitude, longitude, and elevation) since the sensor was installed. The sensor in Maui, Hawaii has traveled ~48 cm latitudinally, and ~84 cm longitudinally, in only 14 years. Continental “drift” can actually happen pretty fast!
We Can (Kinda) See It Happening
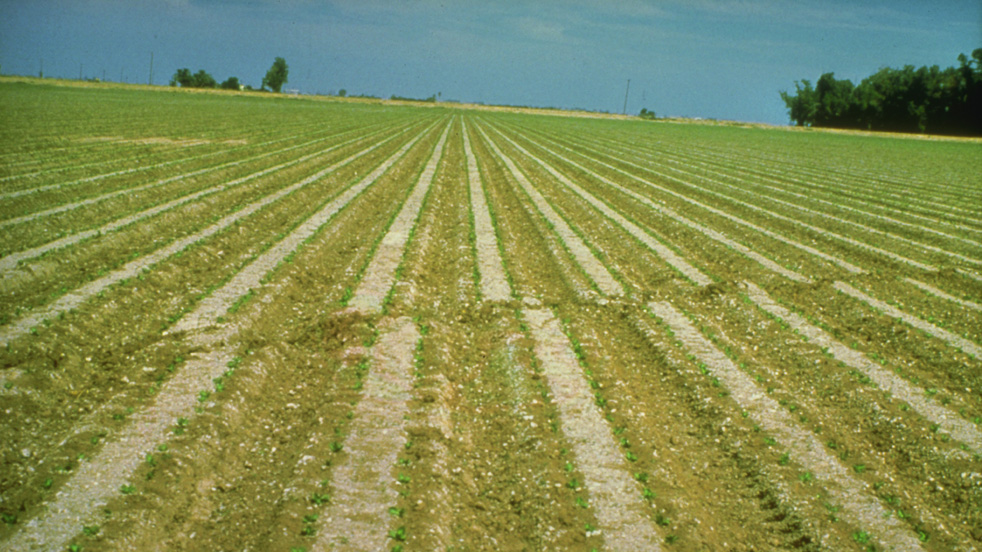
The picture above was taken on a lettuce field in El Centro, California. After a 6.9 earthquake rocked the Imperial Valley in October 1979, visible cracks and ruptures extended for 43 kilometers (~27 miles) along two faults. Looking at the rows of planted lettuce, it’s easy to see that the ground has actually moved.
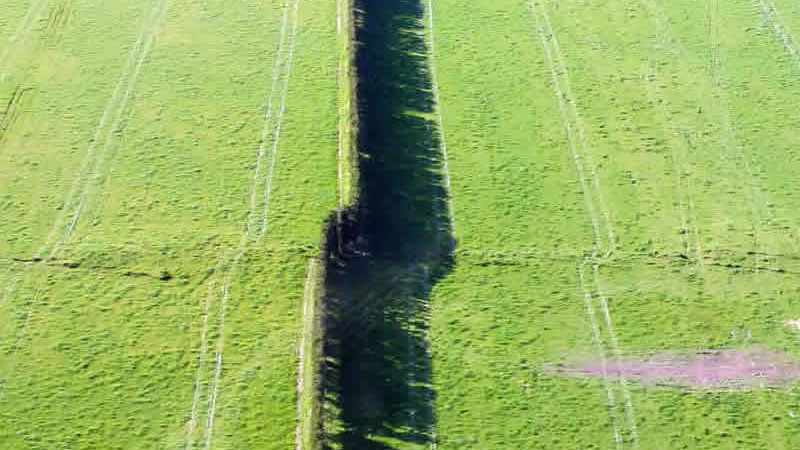
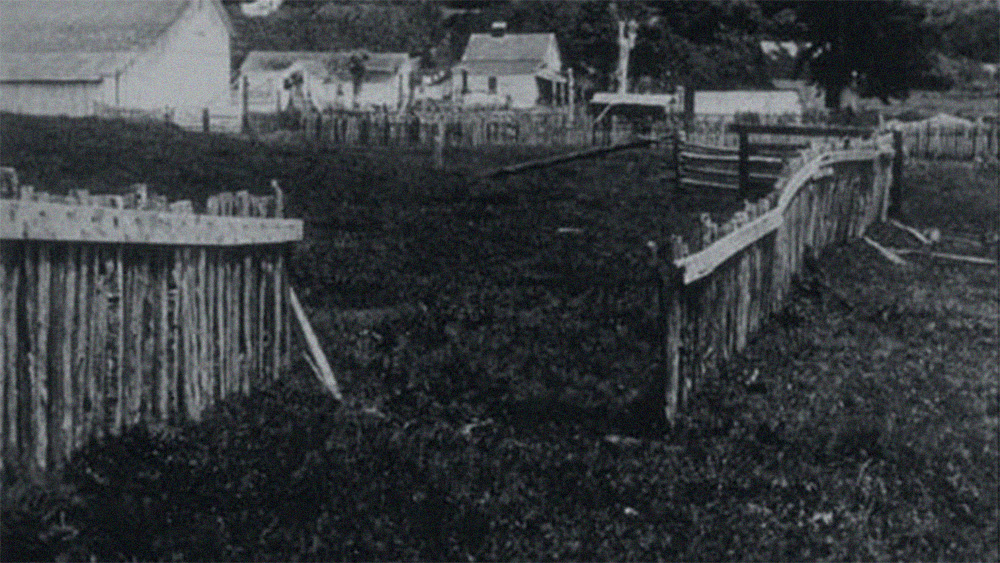
This kind of thing happens quite a bit. Where plates rub against each other above sea level, you can literally see the effects of the plates lurching along, as streets, fences, bridges, and other artificial structures are carried away. Below are two more examples of obvious ground displacement: a line of trees shifted in New Zealand, and a fence that shifted a whopping 3.3 meters at once during the 1906 San Francisco quake.
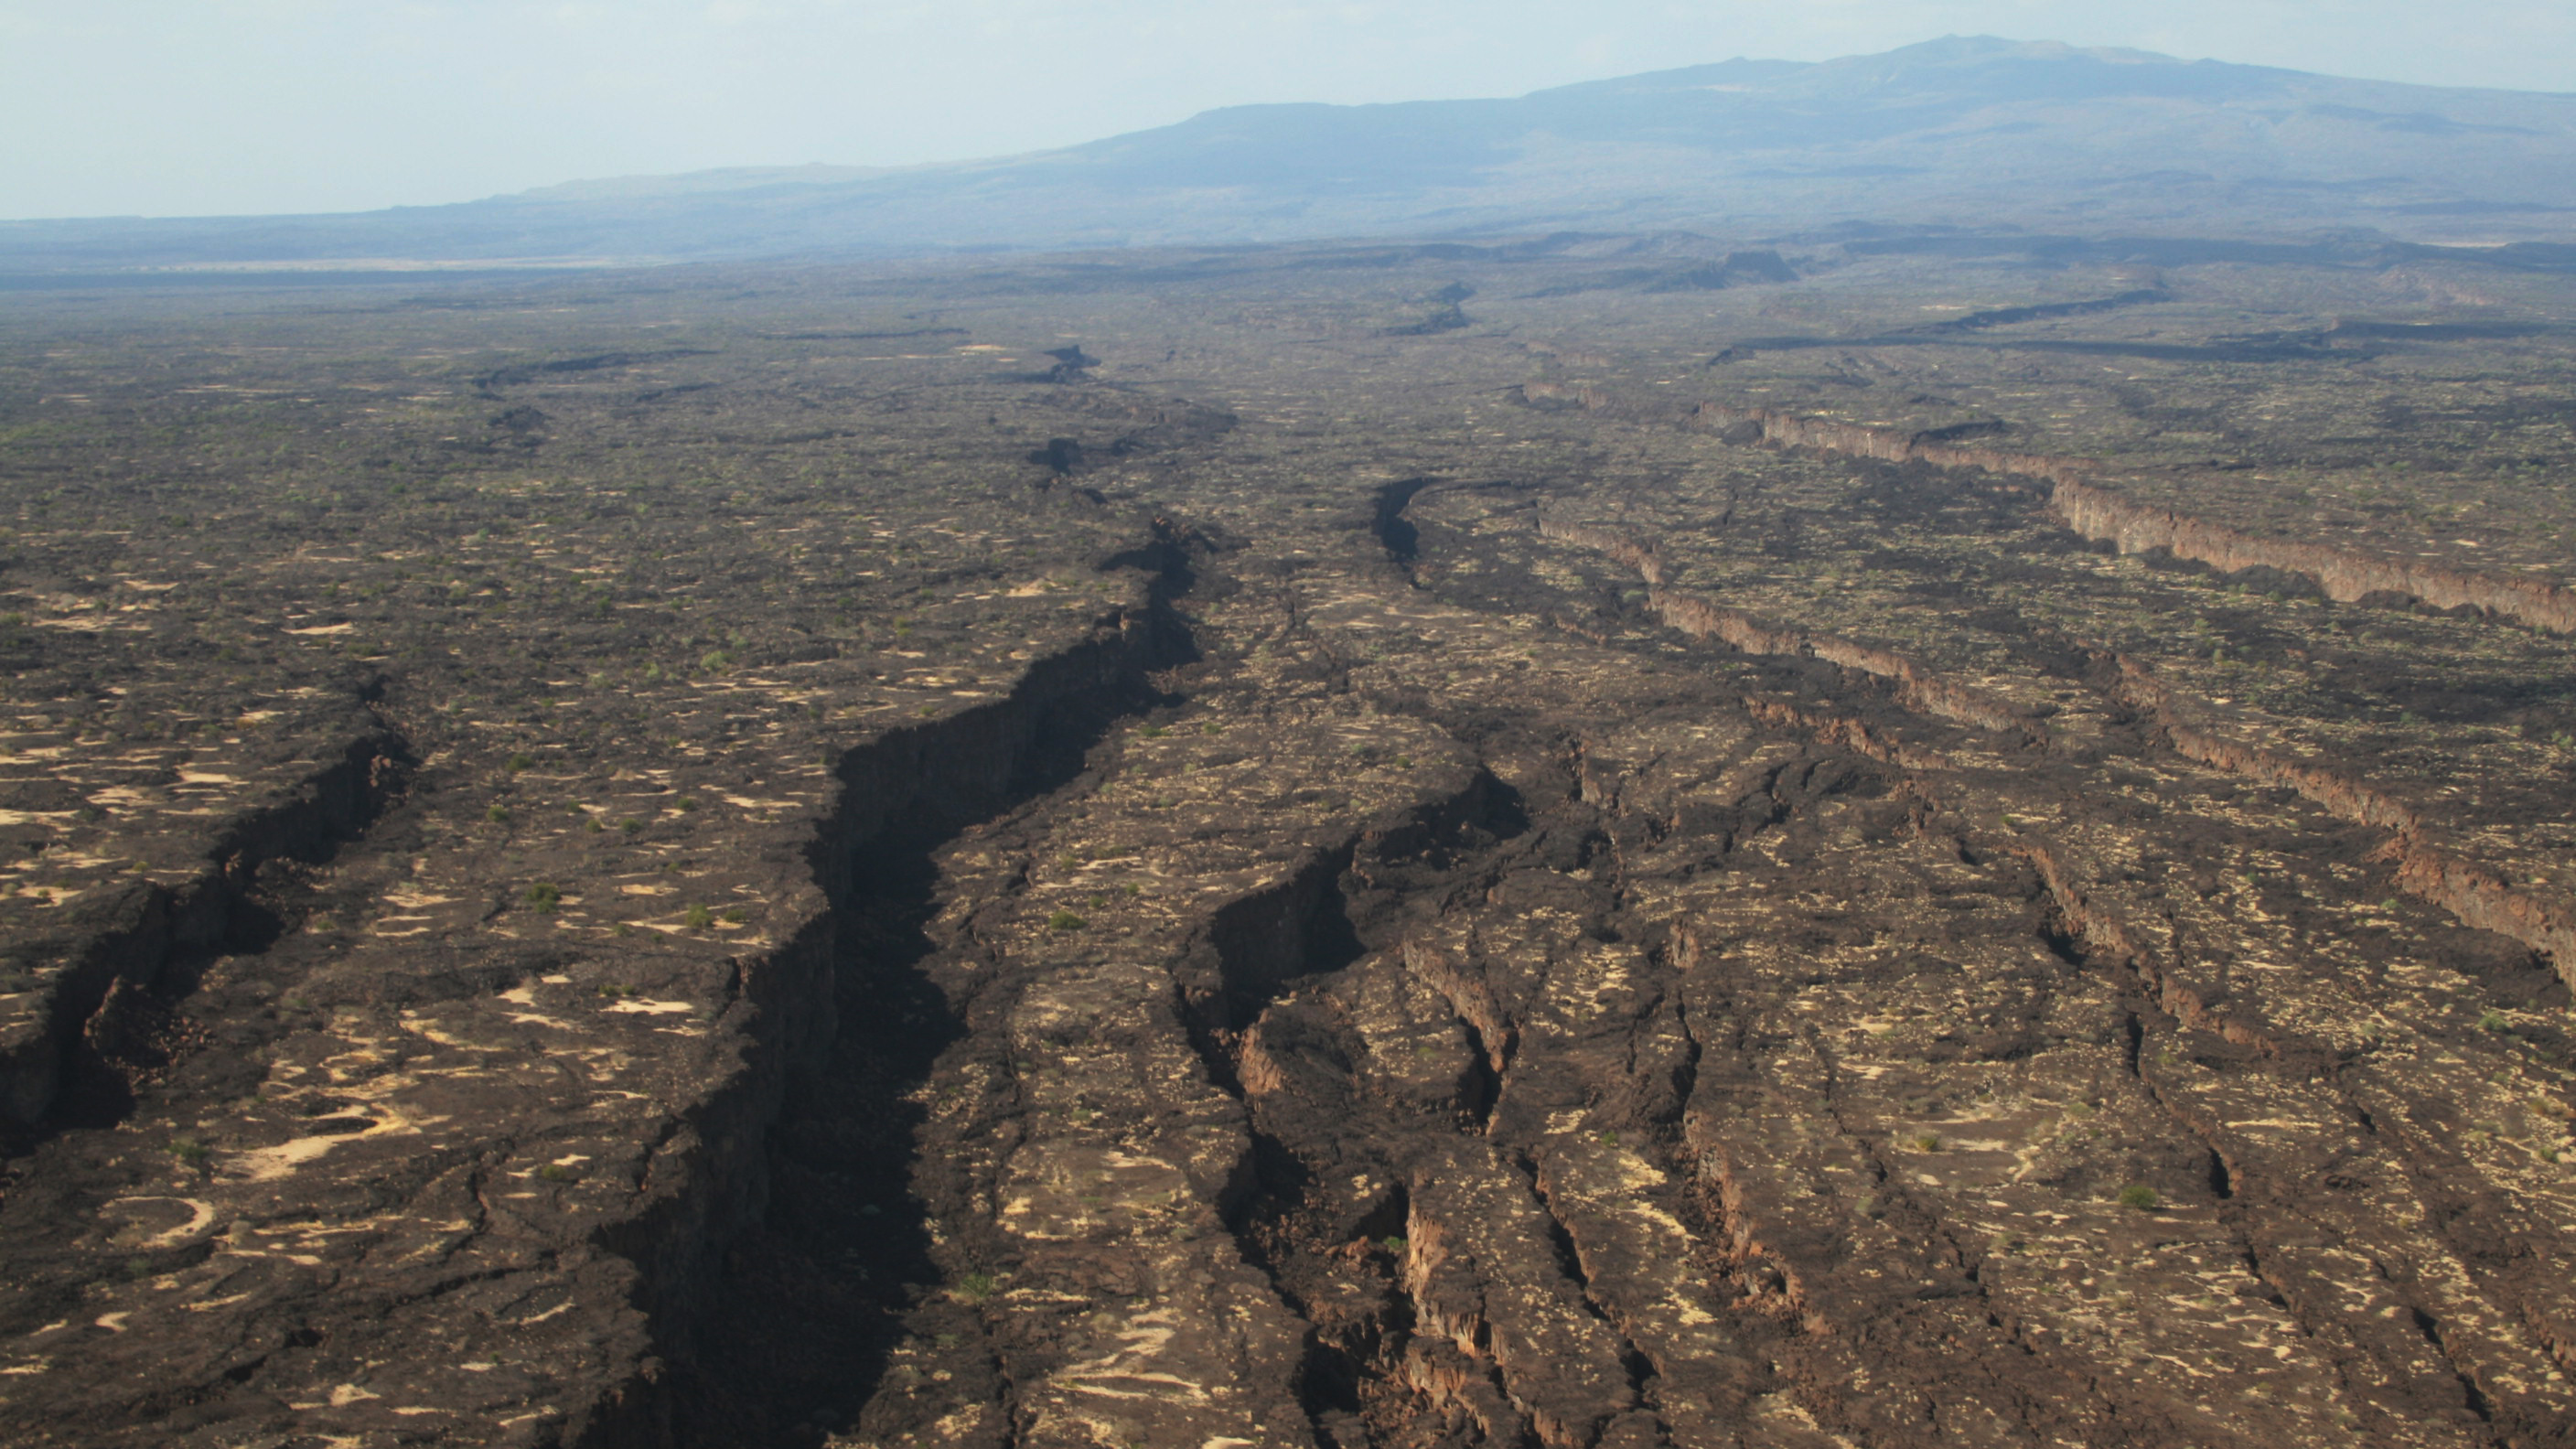
Perhaps the most impressive example of “plate movement that we can see” is the Afar Rift in Ethiopia. In 2005, over a period of several weeks a ~60 kilometer chasm “unzipped” across the Ethiopian desert, with liquid magma forcing its way into the giant chasm as it grew.
This is hardly the first rift in the area . . . the entire 300-kilometer-wide valley is the result of millions of years of similar “unzipping” of solid rock, as the tectonic plate making up most of Africa is peeling away from both the Arabian plate and the Somalian plate. But to get to see the plates advance so recently, and so dramatically, is still pretty neat.
Of course, a new crack in the ground and a few displaced fences don’t “prove” plate tectonics. And surface-level soil displacement may not be a true representation of plate movement below (thanks a_blackpanther for that clarification). But added to all the other evidence, they make an already convincing case even more so . . . and they’re pretty cool to see, too.
This post originally appeared on the Observation Deck.